Comparing players from different era’s is always a thankless task. The game changes, the demands required and the externalities make it a fools errand. But how about comparing free takers over the last decade or so. Sure the game has changed even in that short time frame but free taking, as a closed skill, has remained untouched by rule changes and could make for an interesting analysis of player improvement.
A quick note on the data. It’s all collected by my company Gaelic Stats. We have collected data on senior intercounty games since 2011. For each shot, the player, the foot used, the location (XY) of the shot on the pitch as well as a few other characteristics are collected. The following charts are all for football, championship games, from the seasons 2011-2023. I have only included frees (no sidelines/45’s or penalties). It covers over 6,000 shots in total.
The chart below shows the season on season shot accuracy % of frees at senior level.
Shot Success has (dramatically) improved
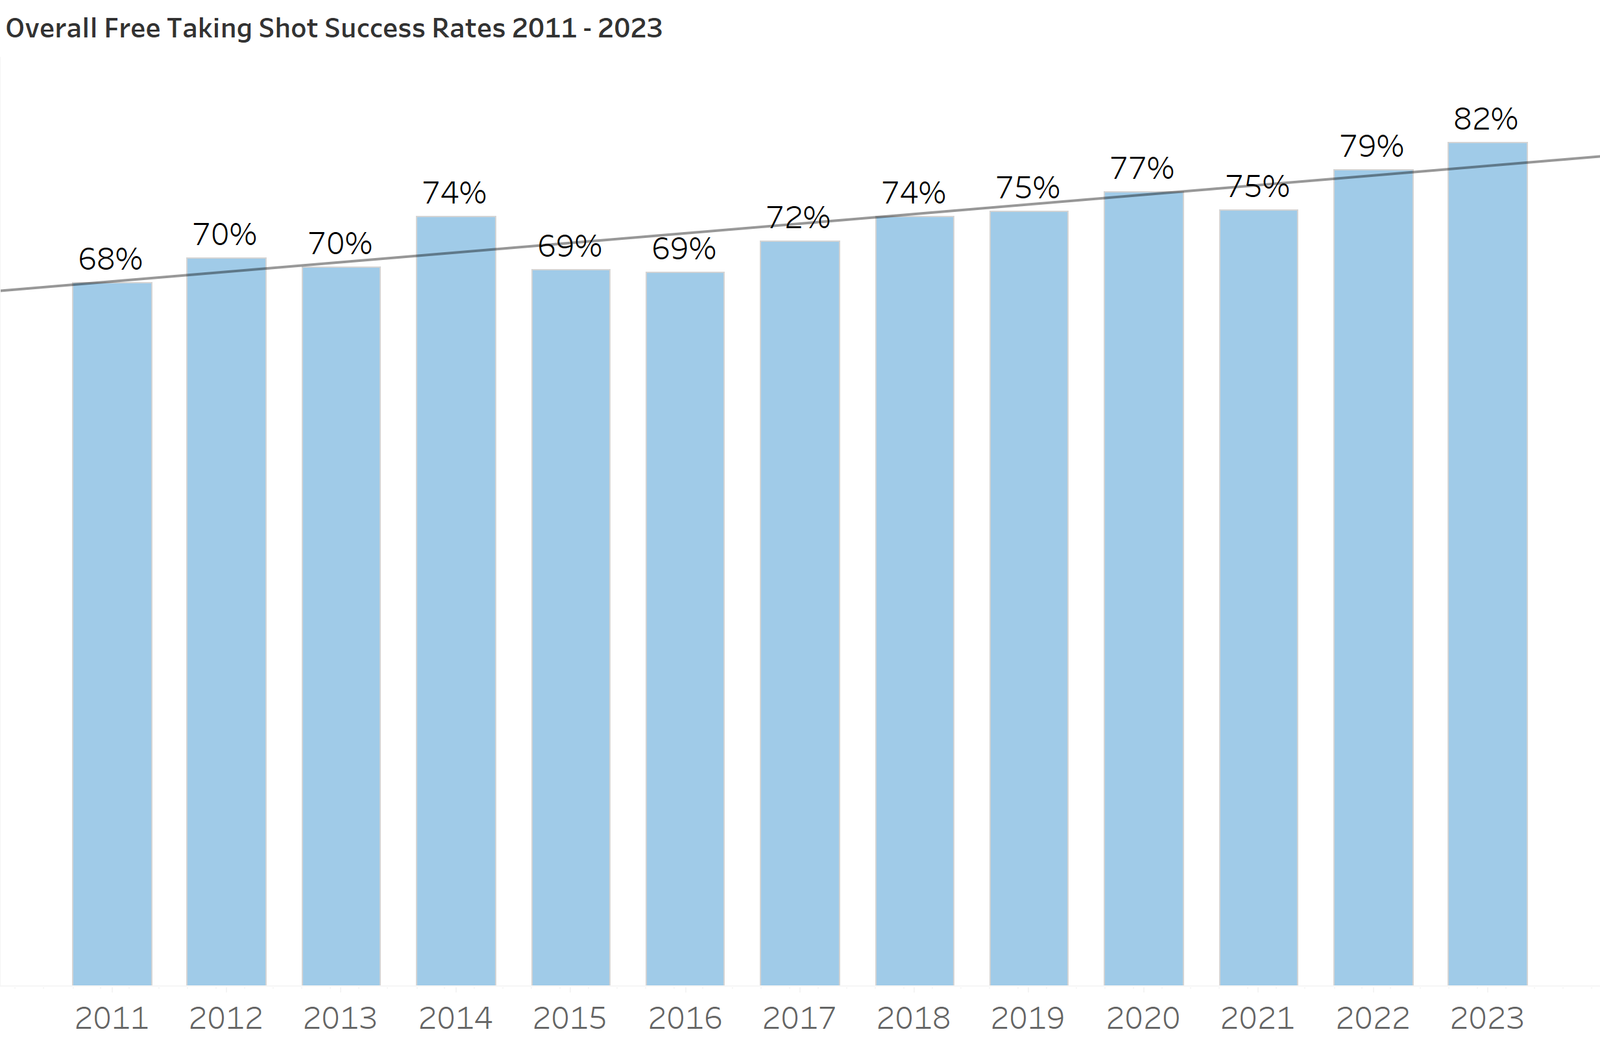
In 2011 the shot success (point or goal) of a free was 68% by 2023 that figure is at a whooping 82%. There is some deviation year to year but as you can see from the trend-line this has been largely increasing year over year.
How difficult was the shot?
The above graph is a simple average, all shots grouped together and takes no account of how difficult the shot was. If Player A attempts a free from 50 meters out v’s 13 meters we are hardly comparing like with like. There are more sophisticated ways to measure shot difficulty (think expected goals), but for the purposes of this analysis let’s keep it simple. Distance is the biggest driver of shot success. The further out, the harder the shot. To illustrate this point take a look at the graph below.

The blue line tracks the average shot success rate at each 1m interval of distance. I’ve highlighted in red where the shot % is still in the 90%’s, after this it starts to drop and falls pretty quickly. So we can see that distance matters, probably not so much up until that 22-26m range, but beyond that it certainly does.
Better or Easier shots?
Given that distance plays an important role we can isolate that when comparing players across the previous 13 seasons. The chart below shows the average distance of a shot since 2011.

In 2011 the average distance of a free was 36.3, in 2023 players are on average are shooting from 31.9 meters (over 4 meters closer to goal on average). This is further visible when we look at the shot maps. Take the example below (for simplicity) I’m comparing 2011 to 2023.

Although this is more of an eye test, the spread of shots is much wider in 2011 than in 2023. You see a lot more shots from near the sidelines and out around the 45. From these 2 charts and the average shot distance chart above it looks like players in 2023 avail of ‘easier’ chances on average than they did in previous years.
Controlling for Distance
The final piece is to compare era’s and shots at a simalar distance. To achieve this I’ve grouped the distances into buckets; 10-19, 20-29 etc…. I also want to compare co-horts. So I’ve split the sample into two groups. Shots in the seasons 2011-2017 (7 seasons) and then 2018-2023 (6 seasons). There is no exact science to this but given the relatively small sample size and variance within a season I went with this method.
The chart below shows for each given bucket how much better (more accurate) players are in 2018-2023 compared to 2011-2017.

It seems clear to me that two things are happening simultaneously to drive the increase in free taking from 68% in 2011 to 82% in 2023.
Firstly and probably more importantly teams are getting smarter about which frees are worth taking on, the average distance of a free is falling, teams likely (or at least should) know the range of their free takes and have adjusted their strategy to take on the correct opportunities.
Secondly, when controlling for distance we see a slight increase in performance. At the 10-19m not so much, but to be honest there is little or no room for improvement here. But as we get into the 30-39m range we see a 3% increase in accuracy. This is not massive, and I was probably expecting this to be bigger, but in a game of 1%’s maybe a 3% increase is more than a good enough in a relatively short time frame.
Are free takers better now than in 2011? Probably yes on both counts really, better at choosing the right opportunities and better at taking them when they come along.
PS – Because I know I will be asked. At the 20-40m range, free takers who kick out of their hands tend to be more accurate and only when you get past 50m does kicking from the ground seem to carry an edge.