12 v 11 Dublin v Mayo

12 v 11 Dublin v Mayo

I’m not sure there is another sport in the world that thinks everything is fixed with a rule change. Already I’ve seen many comments online that, even after week 1, we need to change the trial rule. The main suggestion seems to be that the keeper should have to stay back (inside the arc, 21, half, take your pick) or that if the keeper goes up the defending team only need to keep 2 up top.

The above clip is a really nice angle on a 12 v 11 situation being created by the Dublin goalkeeper advancing forward. I can’t speak for all the 12 v 11 situations created over the weekend but for me this example shows a breakdown in a defensive system rather than some fundamental flaw with the rule.

We can see the setup clearly 11 v 11 with the Gavin Sheridan just coming into shot in the bottom right. Mayo are not man-for-man. They have left a Dublin player just outside the 45 free with their free-man being inside the D.

A few seconds later we can see where Sheridan is heading and the Mayo man on the edge of the Arc decides to follow him. I’ve also highlighted that Mayo seem happy with 3 v 4 on the 45. It’s interesting that the sweeper doesn’t decide to pick up Sheridan’s run but instead leave the Dublin outfield player free on the arc.

Dublin have created the space (or Mayo have given up the space) and Dublin start to shift the ball to the right. The sweeper is now occupied with the Mayo defender stepping out but instead of communicating and picking up a man each they both get attracted to the ball.

Dublin pop the pass wide, the space is made and Mayo can’t scramble back. Score! I know this won’t be representative of all the 12 v 11 situations over the weekend, and sure I accept the goalkeeper has played a role here, but some of the narrative that it is impossible to defend 12 v 11 ?? I just don’t buy that. It’s going to take time for teams to work on this both offensively and defensively, not sure it needs a kneejerk reaction just yet.

Will midrange Shots in Gaelic Football Disappear?

Changes to the Scoring System

The change to the scoring system is one rule enhancement that has the potential to reshape how the game is played. The most obvious comparison to make is with Basketball and their introduction of the 3 point line. The 3 point-line was thought to be a gimmick when first introduced into Basketball and was eventually adopted in the NBA in 1979, but it didn’t permeate all levels of the game until 1986. 

Perhaps more interestingly it wasn’t really until the sports analytics evolution beginning around the start of the millennium that the true value of the 3 pointer was understood, and it still took many years before that knowledge was common practice among the majority of teams. 

This is best illustrated by the amazing work of Kirk Goldsberry. He has chartered the 200 most common shot locations and in the chart below demonstrates how an entire genre of shots has disappeared from the game – The Mid Range Shots! 

This chart is the 200 most frequently used shot zones and doesn’t mean to imply no shots happen in the mid-range but it is telling that the analysis says having a slightly worse efficiency for a 3 pointer and the ‘easy’ close shots are the ones to take – and the mid-range shots are simply not worth the effort. 

Before the introduction of this year’s rule enhancement the GAA analysts and managers  have also had their say on shot efficiency. Distance is the number one factor in predicting shot accuracy. 

In the chart below you can see that as you move further from goal the likelihood of scoring decreases [the anomaly is the shot at goal inside 13m – but after that it follows a very logical downward trend]. 

Just like in any evolution, some people can be ahead of the curve and I think Dublin is a great example of this. They have known for a long time that there comes a certain point where taking a pop at goal just simply isn’t worth it. 

Take a look at the chart below; it shows the % of a team’s shots (from open play) that are taken at 40m or further. It compares Dublin to every other county since 2011. Interesting to see the massive drop from 2011 to 2012 when Jim Gavin took charge.

In the vast majority of seasons teams are taking between 20-25% of shots from 40m or further out, while Dublin never get above 20% and even had as low as 4% in 2022.* 

The reason the mid-range shots have ‘disappeared’ in basketball is simple maths. Given the shooting efficiency of those shots, it’s more advantageous to step back outside the arc and attempt a more difficult 3-pointer. The increase in scoring return is worth the decrease in shot efficiency. 

The big question is will we see the same phenomenon in Gaelic Football and where is the mid-range likely to be? For a team like Dublin attempting shots from greater than 40m has never been worth the ‘risk’ so they try to work the ball closer to goal. But now it is worth something extra, will that change behaviour and at what point is it going to be worth retreating backwards to take the lower % shot?

Returning to the very simplistic line chart above we can pick a point along that line and see the shot efficiency from that point. Let’s take a concrete example. At about 45m from goal,  players score an average of 29% of the time. This shot will now be worth 2 points so the scoring return from this shot will be .58 or 5.8 points for every 10 shots taken. 

At what distance does a team need to be inside the scoring arc to get a similar return? It’s pretty much 25m from the goal. At that point the shot efficiency is .57 or 5.7 points for every 10 shots taken. 30m shots are scored 50% of the time meaning 5 scores per 10 shots. In theory 10 shots from 40-45m are more valuable than 10 shots from the closer range of 30-35m. 

All of this data is obviously calculated before the scoring arc existed and teams and players may change strategies to alter these numbers but this is the best knowledge we have today of current behaviour. Given this, it’s plausible to conclude at this stage that purely from a numbers perspective shots taken between 25m and 40m are going to be the GAA’s equivalent of the mid-range.  They are of less value than the risker and less efficient shots from further out. 

In Gaelic football, the limited number of shots per game—just 50 on average—means that the true shooting abilities of players and teams may not fully reveal themselves within such a small sample size. This stands in stark contrast to basketball, where each team takes nearly 100 shots per game across an 82-game season, providing a far larger dataset to analyze and allowing shooting percentages to stabilize over time.

The results therefore are heavily influenced by individual performances or single events, which makes the numbers in Gaelic football feel a bit unpredictable at times. It’s a reminder that with fewer chances, one great shot—or one bad miss—can change an entire season.

*Before you ask I did check all other teams records and none come even close to Dublin across this time-frame. Kerry are probably the closest and in 2022 only took 3% of shots analysed from 40m or further, but that is an outlier. It seems while most teams and managers might logically conclude that distance is the biggest indicator of shot success, Dublin are the team who most often put it into practice.

Have free takers improved?

Comparing players from different era’s is always a thankless task. The game changes, the demands required and the externalities make it a fools errand. But how about comparing free takers over the last decade or so. Sure the game has changed even in that short time frame but free taking, as a closed skill, has remained untouched by rule changes and could make for an interesting analysis of player improvement.

A quick note on the data. It’s all collected by my company Gaelic Stats. We have collected data on senior intercounty games since 2011. For each shot, the player, the foot used, the location (XY) of the shot on the pitch as well as a few other characteristics are collected. The following charts are all for football, championship games, from the seasons 2011-2023. I have only included frees (no sidelines/45’s or penalties). It covers over 6,000 shots in total.

The chart below shows the season on season shot accuracy % of frees at senior level.

Shot Success has (dramatically) improved

In 2011 the shot success (point or goal) of a free was 68% by 2023 that figure is at a whooping 82%. There is some deviation year to year but as you can see from the trend-line this has been largely increasing year over year.

How difficult was the shot?

The above graph is a simple average, all shots grouped together and takes no account of how difficult the shot was. If Player A attempts a free from 50 meters out v’s 13 meters we are hardly comparing like with like. There are more sophisticated ways to measure shot difficulty (think expected goals), but for the purposes of this analysis let’s keep it simple. Distance is the biggest driver of shot success. The further out, the harder the shot. To illustrate this point take a look at the graph below.

The blue line tracks the average shot success rate at each 1m interval of distance. I’ve highlighted in red where the shot % is still in the 90%’s, after this it starts to drop and falls pretty quickly. So we can see that distance matters, probably not so much up until that 22-26m range, but beyond that it certainly does.

Better or Easier shots?

Given that distance plays an important role we can isolate that when comparing players across the previous 13 seasons. The chart below shows the average distance of a shot since 2011.

In 2011 the average distance of a free was 36.3, in 2023 players are on average are shooting from 31.9 meters (over 4 meters closer to goal on average). This is further visible when we look at the shot maps. Take the example below (for simplicity) I’m comparing 2011 to 2023.

Although this is more of an eye test, the spread of shots is much wider in 2011 than in 2023. You see a lot more shots from near the sidelines and out around the 45. From these 2 charts and the average shot distance chart above it looks like players in 2023 avail of ‘easier’ chances on average than they did in previous years.

Controlling for Distance

The final piece is to compare era’s and shots at a simalar distance. To achieve this I’ve grouped the distances into buckets; 10-19, 20-29 etc…. I also want to compare co-horts. So I’ve split the sample into two groups. Shots in the seasons 2011-2017 (7 seasons) and then 2018-2023 (6 seasons). There is no exact science to this but given the relatively small sample size and variance within a season I went with this method.

The chart below shows for each given bucket how much better (more accurate) players are in 2018-2023 compared to 2011-2017.

It seems clear to me that two things are happening simultaneously to drive the increase in free taking from 68% in 2011 to 82% in 2023.

Firstly and probably more importantly teams are getting smarter about which frees are worth taking on, the average distance of a free is falling, teams likely (or at least should) know the range of their free takes and have adjusted their strategy to take on the correct opportunities.

Secondly, when controlling for distance we see a slight increase in performance. At the 10-19m not so much, but to be honest there is little or no room for improvement here. But as we get into the 30-39m range we see a 3% increase in accuracy. This is not massive, and I was probably expecting this to be bigger, but in a game of 1%’s maybe a 3% increase is more than a good enough in a relatively short time frame.

Are free takers better now than in 2011? Probably yes on both counts really, better at choosing the right opportunities and better at taking them when they come along.

PS – Because I know I will be asked. At the 20-40m range, free takers who kick out of their hands tend to be more accurate and only when you get past 50m does kicking from the ground seem to carry an edge.

Do 75% of Scores really come from Inside the D?

Do 75% of Scores really come from Inside the D?

In an interview just after Roscommon dumped Mayo out of the 2023 Connacht Championship Davy Burke was describing his team’s defensive set-up and said that “70-75% of scores come from inside the D”. Managers are likely no different to the rest of the population in reaching for a stat when trying to make a pont. The validity or accuracy of said stat is not the point, the principle is it helps with the argument, it’s a perfectly natural thing to do. 

But is he right? And even if he’s wrong, how wrong is he? 

As ever there is still some subjectivity required in this analysis of the data. Where exactly is inside the D and do we count all shots or just shots from play? The point is not to take Davy Burke’s comment entirely at face value but let’s examine how close he was based on some definitions of inside the D and looking at only shots from play. 

I’m using a rectangle that covers the top of the D to the goal-line as illustrated below.

First let’s take a broad look at shooting accuracy from inside and outside the D. As a good rule of thumb the further away from the goal you get the less likely you are to score.

No surprise that players on average score at a higher % rate from inside the D v’s outside. ~6 out of every 10 shots from play result in a score from inside compared to just 4 successful shots from outside the D. So far so obvious.

But what about the % of scores that come from inside the D. Looking at over 10,000 scores across the last 12 Championship seasons, the average is not 75% but closer to 44%. When we look at this on a season by season the number is not vastly different since 2011. It’s been as low as 40% and last year saw a high of 48% but this all looks very consistent year to year.

I know my definitions might differ from others on only including scores from play and where exactly the scoring zone is but I think we can reasonably call this 75% stats as not accurate. In fact over the last 12 seasons more scores from play come from outside the D than inside it. 

I know I’m calling this 75% as not accurate, but the sentiment is obviously correct. We can take a slightly extreme example to make this point. A team gets on average 21 shots from play per game (again this is frighteningly consistent across the last 12 seasons) and we know that the closer you are to goal the more likely you are to score. 

To take our very binary inside/outside the D analysis; if a team took all of their 20 shots from outside the D they would score on average 8 times (and almost certainly no goals). By contrast taking those same 20 shots inside the D should yield you 12 scores, a 50% increase before you factor in any goals. Across a season the more you restrict shots from inside you are building a nice edge in your favour and as the successful teams will play more games in this new format, the higher the impact these edges can have across your season. It’s really no wonder teams defend the D like its sacrosanct turf, but heartening to know that if you attend a game you will still see more points scored from outside the D than you think.

Who’s Better?

Gaelic Football Viz to help you compare forwards from different era’s. Who has scored them quicker?

Just how quick is Cluxton

For an age the talk has been to push up or not on Cluxton’s kickouts. Regardless of what you would like to do, the practicality of doing it is another thing altogether.

TV angles don’t usually allow you pick up the movement of the outfield players but there was one great example of just how quickly Cluxton and Co switch on for their own Kickout.

Kerry take a shot (from open play). So this isn’t an opportunity for either side to plan a move.

As the ball is still in the air, in fact it’s only barely left the Kerry foot before Cluxton reaches down to get the second ball.

It’s no use of Cluxton is the only one thinking like this. But he’s not. As you can see the ball is still in the air. Cluxton comes out with his head up looking for the runs and it’s Ciaran Reddin in this case who has already set-off.

Notice as well that the Dubs are great at getting out of the way to make that pocket of space bigger for the runner.

It’s 6 seconds from the ball leaving the Kerry foot until Cluxton kicks the ball out.

Even with 10 men in shot, the speed of thought and precision of execution makes it so difficult to compete.

How long is the season?

Training age is the cumulative amount of time you’ve spent training for a particular sport. It refers to a cumulative workload (and skill level) built over years and years.

This of course is not just about time. I’ve been driving for 16 years and I’ve seen very little improvement. You need to be in and around environments that push you, have coaches or mentors that test you constantly to evolve and get better.

As a player moves from club to county the premise is that he is now exposed to better coaches, surrounded by better players in training and playing a higher standard of opposition. All of these factors should contribute to a player and team’s development.

To bridge the performance gap teams started to put in more hours. Early morning training and extra sessions were a plenty. But there are only so many hours in the day. Counties are finally realising that more does not necessarily equal better. Now there is more emphasis on talent both on the pitch and behind the scenes.

This week Andy McEntee highlighted the importance he placed on having his preferred Strength and Conditioning coach as part of, not just his management ticket, but the entire Meath set-up.

“To be perfectly honest, it was part of the gig when I came in. I would have been reluctant to do it without him, that is how much I regard him.”

He is now fulfilling a role similar to Bryan Cullen for Dublin or Cathal Cregg for Connacht. You can expect many other counties to follow suit, counties employing expertise to work across an entire system rather than on a nod and a wink from the senior manager.

It highlights the importance of getting the right people in behind the scenes. But the nature of the competition structure builds in a constant disadvantage. Successful teams play more games and by extension have longer seasons (under expert supervision).

Last season as we mentioned Dublin began their competitive season in January and ended it in October. Wicklow were out by the middle of June.

What is startling when you look at the actual figures, the cumulative effect of shorter seasons means there is a built in sense of the inevitable about the inter-county scene.

Even if the much maligned county board could stump up to hire all the ologists possible, unless teams start winning and making their season longer it’s hard to see them ever catching the big guys.

The table below shows the week each county has finished their season in for the last 10. For example in 2016 Dublin & Mayo finished in week 40 while a team like Down finished a full 14 weeks previously.


Taking an average of just 3 training sessions a week that’s at least 42 training sessions. Even if you said the backroom teams of these two counties were of equal quality (and that’s an unrealistic assumption) that’s a lot more expert-led training those Dublin players have over Down. Starting the 2017 season Dublin are at least 42 sessions and 7 games ahead of Down, all other things being equal.

When we add this up over the course of say 10 years we can see that Kerry and Dublin average a season of about 36 weeks while mid-tier teams like Armagh, Kildare & Roscommon have seasons lasting just 29 weeks.

That’s on average about 7 weeks per year which is over 200 extra training sessions in a 10 year period. (again assuming our 3 sessions a week measure)

Build in the squad turnover most teams outside of Monaghan, Donegal, Dublin and Kerry have and you can see a huge discrepancy open up between the have’s and have not’s.

It’s a self-fulfilling prophecy. Whether winning causes more stable squads or vice-versa the net result is the same. Winning teams have longer seasons, with more stable squads, usually under expert led coaching staff.

I had this conversation recently with a manager from a weaker county. There were the usual grievances about receiving a more level playing field in terms of financing but what really transpired was that without extending the season (games and time) his players would file back to the clubs where the structures just aren’t there to keep the development going.

I’m no believer that we should create an artificial method to get weaker teams into the semi-finals. Any competition should be about getting the best to play each other but the different season length has a big impact on the ability of the weaker counties to make up the difference, even if the funding is in place.

Staying alive in the championship has many upsides (not least you might actual win something) but not to be underestimated is the amount of training time these players receive or more importantly the weaker county players miss out on. Having additional games is vital but if the actual season length allows for such large discrepancies it’s hard to see teams making those giant leaps forward.

Gaelic Football League Tables 2008 – 2017

Historic League Tables 2008 – 2017

How Might Teams Exploit The Mark

There has been plenty already written about the merits or otherwise of introducing the Mark. Whether it’s needed or not is not the point of this article. It’s here to stay so what can teams expect and how might they use the new rule to gain an advantage.

For the team kicking the ball out I think the mark will offer little or no advantage. Maybe in the last few minutes of a game if you want to slow things down, but you only have 5 seconds to kick the ball so you better be quick.

Having sat in on a recent rules presentation at the National Coaching Conference in early January I believe the biggest issue with the Mark could be the infringements that happen around it rather than the Mark itself.

The Mark is borrowed from the AFL but in AFL the onus is on the player who caught the ball (took the mark) to move back. The point at where the mark is taken is where the defender can stand. They are under no onus to move back. They stand there ground and if the marking player passes that point(allowing for momentum) he is deemed to be playing on and can be tackled.

Here is what the AFL rule states;

16.1.1 Standing the Mark
When a Player is awarded a Mark or Free Kick or is Kicking into play after a Behind has been scored, one Player from the opposing Team may stand at the position on the Playing Surface where the Mark or Free Kick was awarded or where the field Umpire otherwise directs the Player to stand. The position on the Playing Surface where the opposing Player stands is known as “the mark”.

16.1.2 Protected Area
The Protected Area is a corridor which extends from 5 metres either side of the mark to 5 metres either side of, and a 5-metre radius behind, the Player with the football, as illustrated in Diagram 2. No Player shall enter and remain in the Protected Area unless the field Umpire calls “Play On” or the Player is accompanying or following within 5 metres of their opponent.

In the new rule introduced for football the onus is on the defending player (player who didn’t win the mark) to retreat 13m or if the player who made the mark decides to play on to let him take 4 steps (or see (I) below).

If not, a free kick is awarded, which can be taken by any player.

Because of the proximity to the opposition goal the Mark is much more likely to offer an advantage to the non-kicking team than it is to the kicking team and this secondary foul issue might be the reason.

Let’s look at a couple of scenarios;

Scenario 1; You take your kickout, it travels past the 45 and a successful mark is taken by the team who kicked the ball out. The player decides not to play on but take the ‘free kick’ option. The rule states he has 5 seconds to kick the ball and as with free kick rules the ball must travel 13m. Failure to take the kick on time will result in a throw up. While failure to kick it the required distance will result in a free to the opposition.

It might be the case that not kicking 13 happens very infrequently currently, but players aren’t taking frees with a 5 second time pressure.

The decision making of the player who took the mark will need to be sharp and those around him will need to keep their distance. While attacking teams might lose the initial kickout there could be an upside to having pressure on high up the pitch and forcing the foul or forcing the team to aimlessly kick it away.

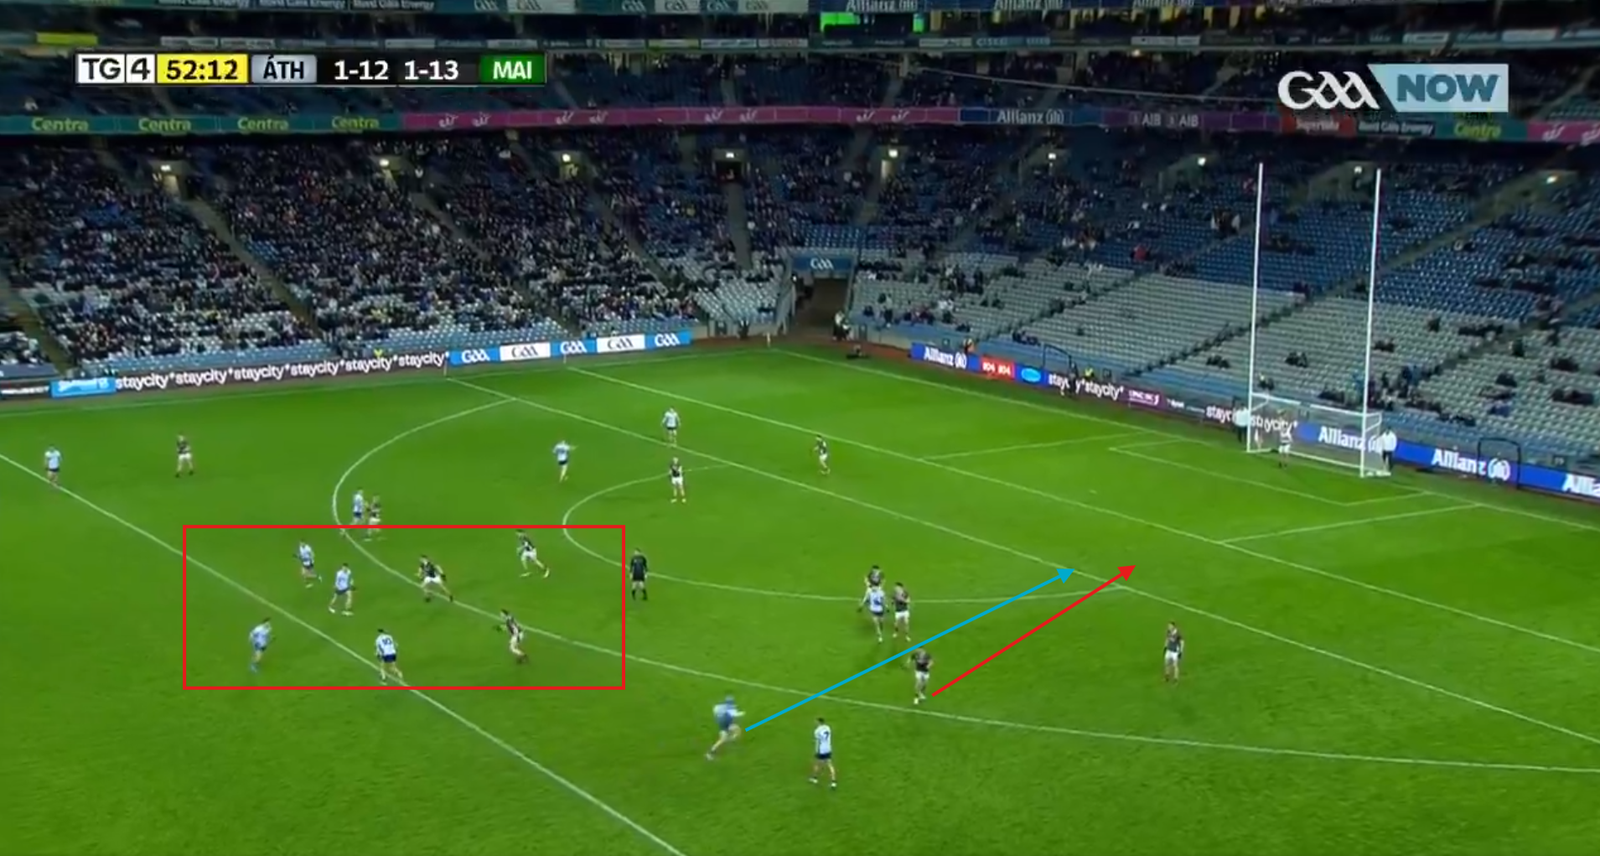
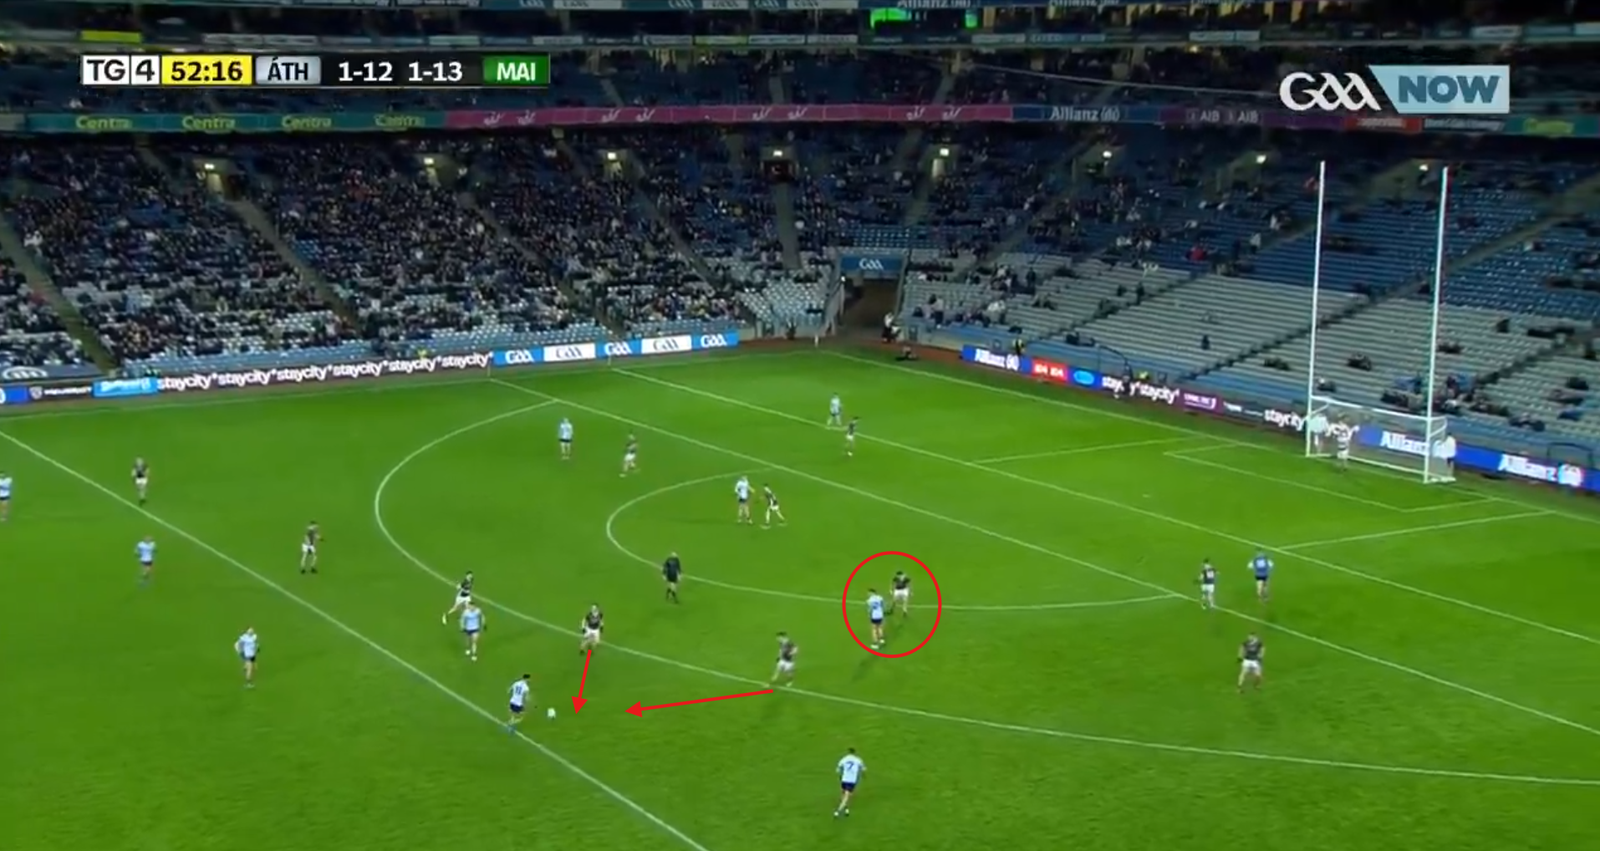
Scenario 2; The attaching team win the Mark.

This is the one that I could see causing the most issues and perhaps will result in teams at least exploring the possibility of pushing up on opposition kickouts, even if that’s just for key moments of the game.

The same 5 second rule applies to the player taking the mark, So while you have the opportunity to shoot, it’s only the player who catches the ball that can shoot directly from the mark. Considering the time pressure, the likely distance from goal (min 45m) and the chance of your free taker taking the mark I see direct shots as a rare occurrence.

Again though I see the secondary fouls, infringements around the Mark, as being the most dangerous and causing the most controversy. These are as likely to happen in wither direction but having the ball moved from your 45 to your 65 doesn’t carry the same importance as having it moved from outside the scoring zone to inside it.

In the FAQ section on the GAA site there is the following;

8. If the player who has been awarded the Mark chooses to take a free kick and a player from the opposing team blocks or attempts to block that kick within 13m or interferes with the player who has chosen to take the kick, what is the award?

A free kick 13m more advantageous shall be awarded.

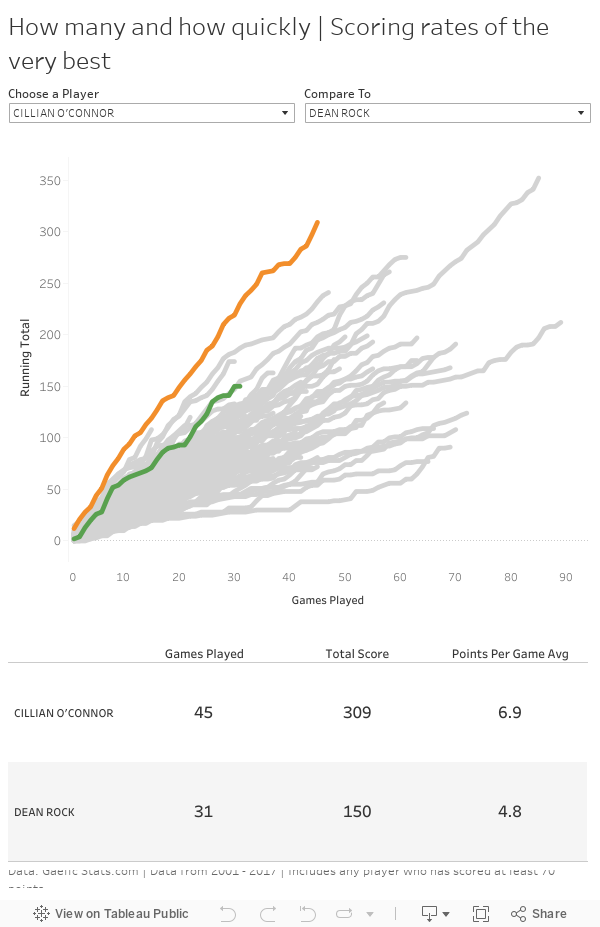
Case 1; Diarmuid Connolly catches the ball and Lee Keegan doesn’t retreat 13m quick enough the ball gets moved forward 13m and can now be given to Dean Rock to take the subsequent free. While the advantage is minimal from taking the mark, it’s much greater if you can ‘win’ a secondary free.

Discipline will be important but also referees will have to deal with quick free attempts where the defending player hasn’t retreated or maybe hasn’t had time to.

Case 2; Connolly decides to play on immediately following the Mark;

The rule states;

(b) Play on immediately

(i) In this circumstance the player may not be challenged for the ball until he carries the ball up to a maximum of four consecutive steps or holds the ball for no longer than the time needed to take four steps and/or makes one act of kicking, handpassing, bouncing or toe-tapping the ball.
(ii) If the Player is illegally challenged, a free kick shall be awarded to his team from the point at which the challenge is made, and this free kick may be taken by any player on his team.

This is where the difference the Mark rule as used in AFL and the new GAA is especially important.

Suppose in our fictional example Connolly catches a mark and decides to play on.

Lee Keegan can’t tackle him for 4 steps. In AFL Keegan would be under no obligation to retreat or move out of the way. As long as he holds his position at the point of the mark it’s fair. In Football that’s not the case, he can be in close proximity but he can’t tackle Connolly.

How disciplined players are around this will be key. Letting any forward take 4 steps towards goal will not come easy to tenacious defenders.  Referees interpreting when a ‘tackle’ is made will also be key. Staying close enough but not actually tackling him will require some fine tuning.

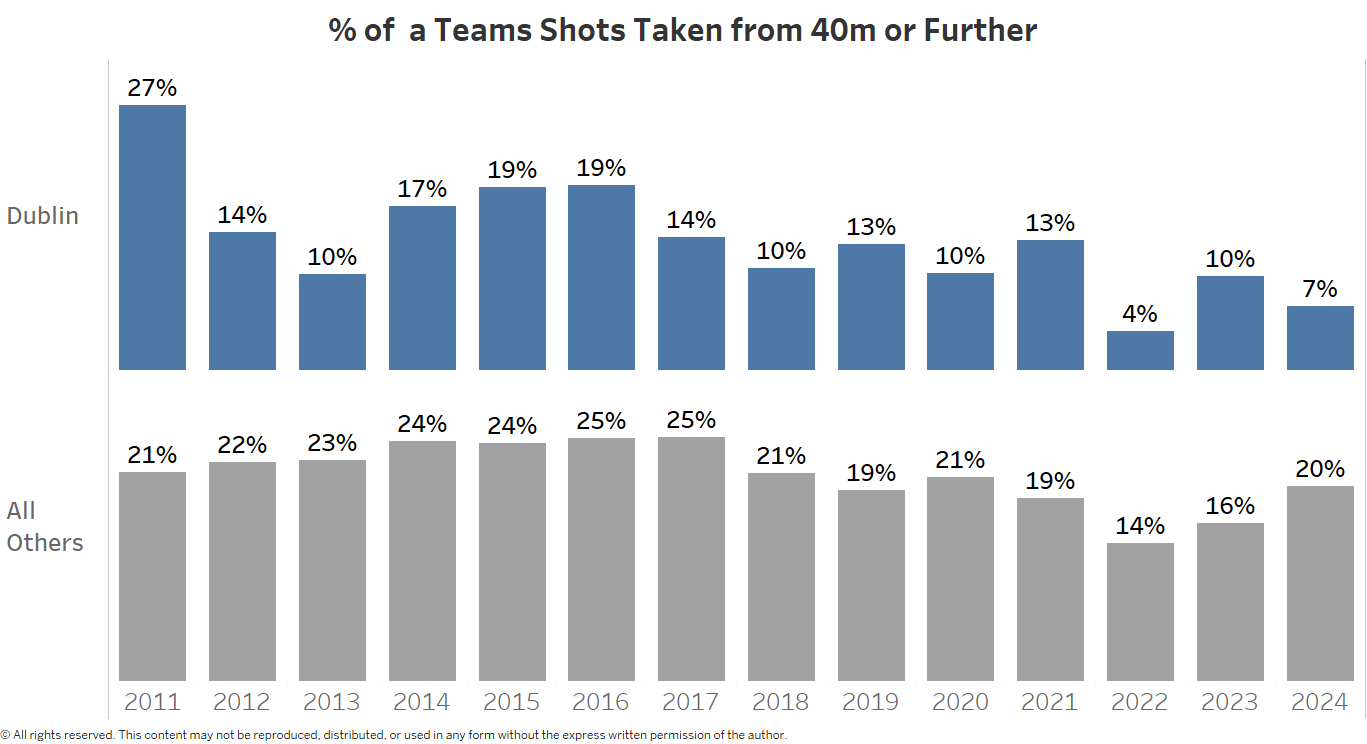
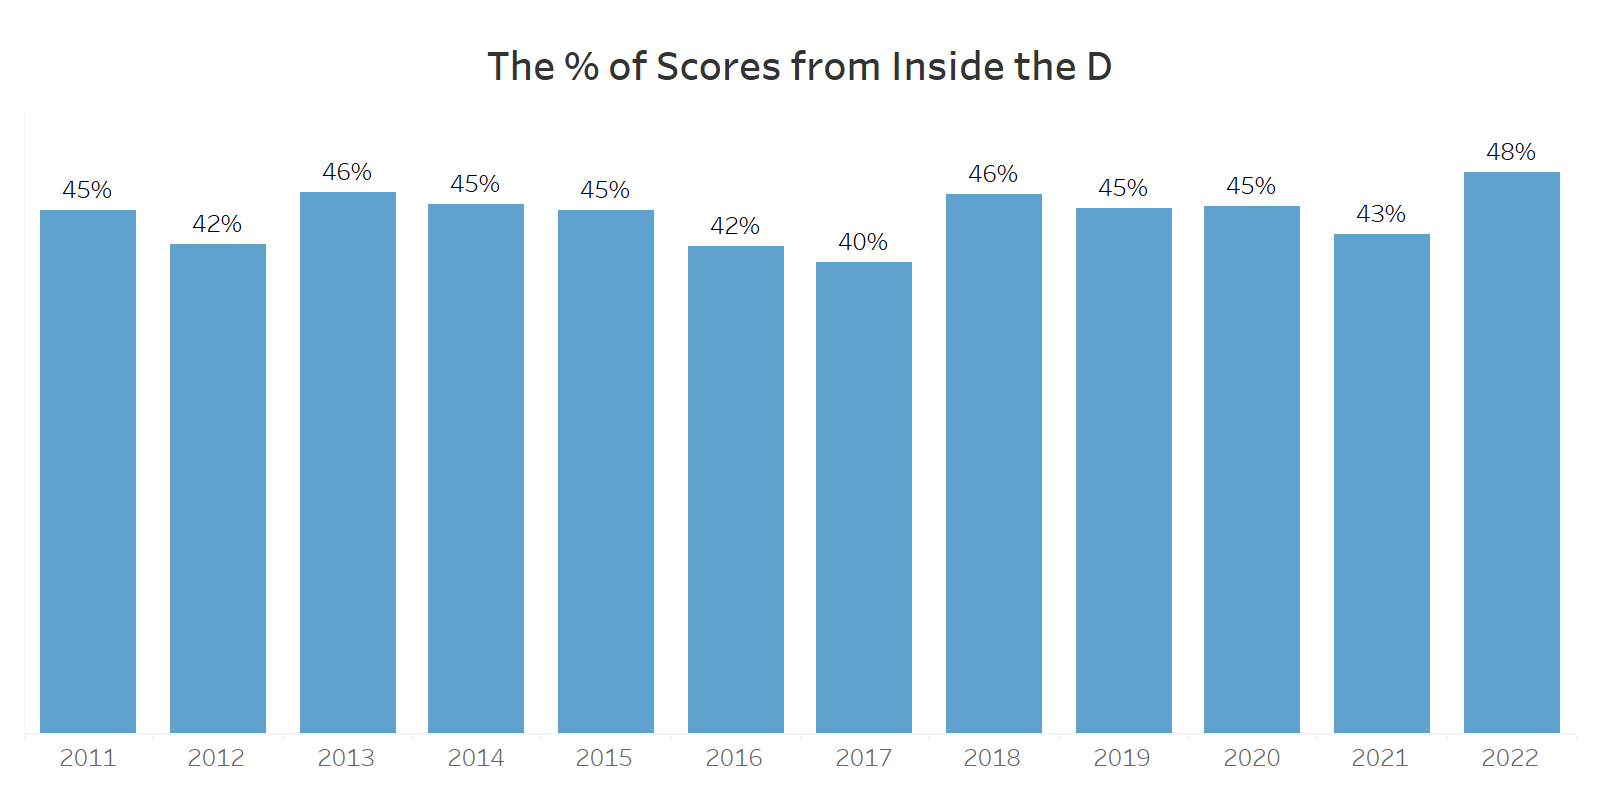
The chance of winning an opposition long kickout (past the 45m line) is currently 45%. If the non-kicking team feel that the mark offers them an improved advantage, from either an initial mark or forcing secondary frees, maybe we will see teams push up more, less short kickouts and more high fielding. Maybe?

The common consensus is that nothing will really change, but no one knows for sure. There are plenty of bright minds in the game who will be doing more than just saying ‘this won’t change a thing’. They’ll be experimenting, planning and watching endless hours of tape.

It won’t surprise me at all if somebody has something up their sleeve to exploit this new rule, but it’s also very likely we will have to wait until August before we see it.

County Football Form Guide

Check out the form of any county over the previous 35 games. You can use the filter to look at Championship, League or both.