Do 75% of Scores really come from Inside the D?
In an interview just after Roscommon dumped Mayo out of the 2023 Connacht Championship Davy Burke was describing his team’s defensive set-up and said that “70-75% of scores come from inside the D”. Managers are likely no different to the rest of the population in reaching for a stat when trying to make a pont. The validity or accuracy of said stat is not the point, the principle is it helps with the argument, it’s a perfectly natural thing to do.
But is he right? And even if he’s wrong, how wrong is he?
As ever there is still some subjectivity required in this analysis of the data. Where exactly is inside the D and do we count all shots or just shots from play? The point is not to take Davy Burke’s comment entirely at face value but let’s examine how close he was based on some definitions of inside the D and looking at only shots from play.
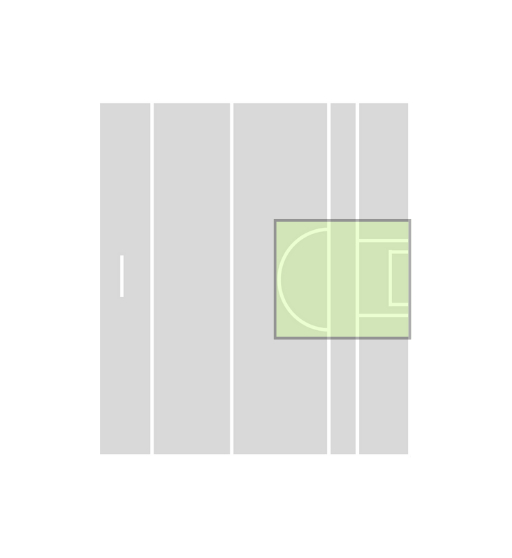
I’m using a rectangle that covers the top of the D to the goal-line as illustrated below.
First let’s take a broad look at shooting accuracy from inside and outside the D. As a good rule of thumb the further away from the goal you get the less likely you are to score.
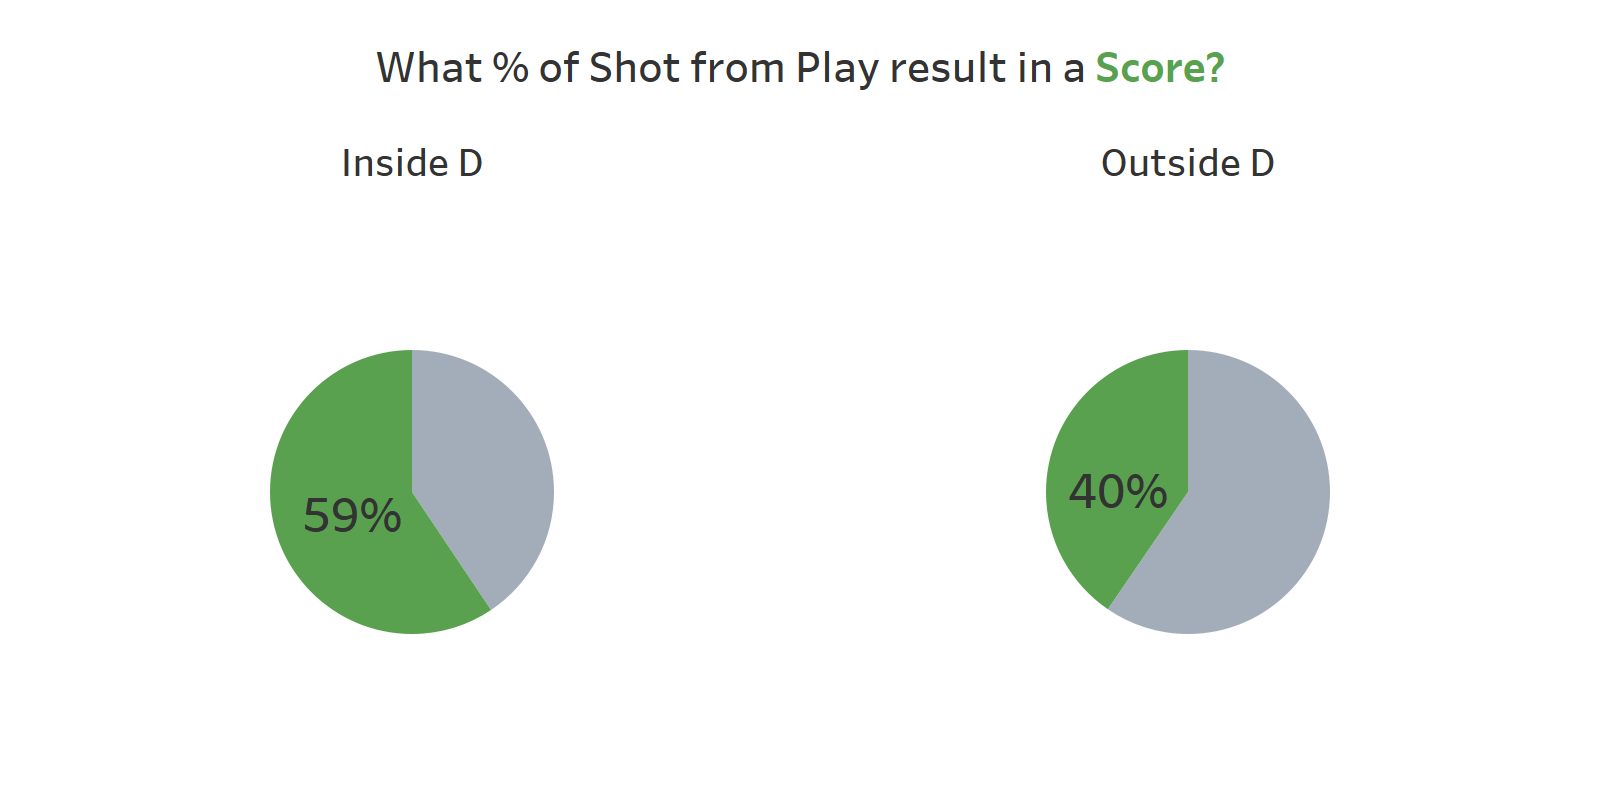
No surprise that players on average score at a higher % rate from inside the D v’s outside. ~6 out of every 10 shots from play result in a score from inside compared to just 4 successful shots from outside the D. So far so obvious.
But what about the % of scores that come from inside the D. Looking at over 10,000 scores across the last 12 Championship seasons, the average is not 75% but closer to 44%. When we look at this on a season by season the number is not vastly different since 2011. It’s been as low as 40% and last year saw a high of 48% but this all looks very consistent year to year.
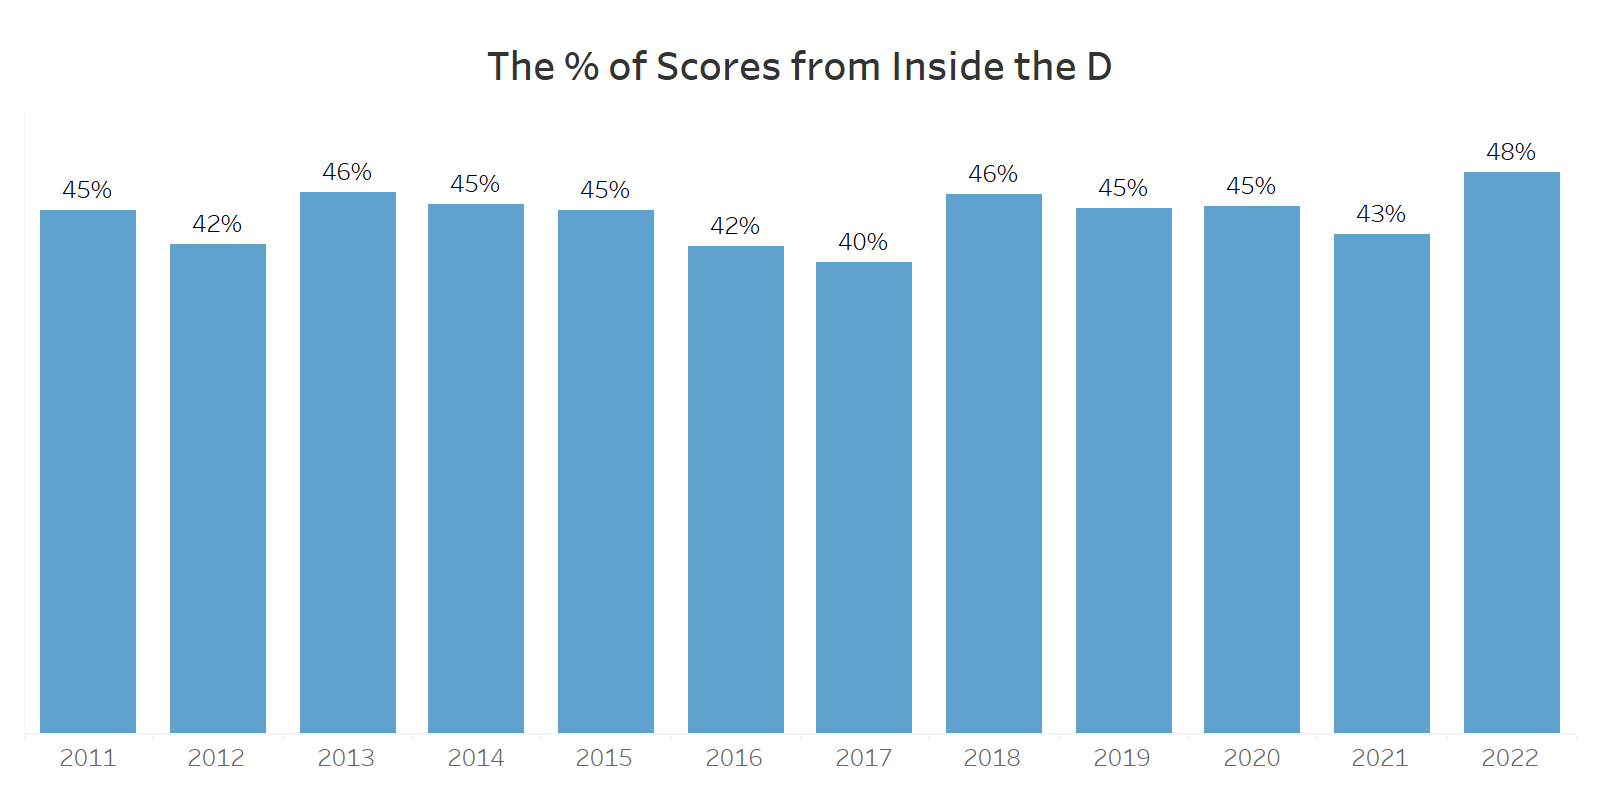
I know my definitions might differ from others on only including scores from play and where exactly the scoring zone is but I think we can reasonably call this 75% stats as not accurate. In fact over the last 12 seasons more scores from play come from outside the D than inside it.
I know I’m calling this 75% as not accurate, but the sentiment is obviously correct. We can take a slightly extreme example to make this point. A team gets on average 21 shots from play per game (again this is frighteningly consistent across the last 12 seasons) and we know that the closer you are to goal the more likely you are to score.
To take our very binary inside/outside the D analysis; if a team took all of their 20 shots from outside the D they would score on average 8 times (and almost certainly no goals). By contrast taking those same 20 shots inside the D should yield you 12 scores, a 50% increase before you factor in any goals. Across a season the more you restrict shots from inside you are building a nice edge in your favour and as the successful teams will play more games in this new format, the higher the impact these edges can have across your season. It’s really no wonder teams defend the D like its sacrosanct turf, but heartening to know that if you attend a game you will still see more points scored from outside the D than you think.