Good Artists Copy; Great Artists Steal
If you follow any of the soccer analysts you will constantly hear the term Expected Goals. Soccer is a low scoring game and Expected goals is a better way to both accurately reflect a players true scoring value and also how many he is likely to score in the future given the same opportunities. It turns out that simply looking at how many goals a player scored in one season is not a good prediction of how many he will score next season and the season after that. Expected goals is a better way to do that. Perfect? No, but better. And when you are buying players for £50m+ every little helps.
You can find out a little more about the soccer versions and their rational by reading this summary post – which links to all the mains models. http://mackayanalytics.nl/2016/03/28/how-good-are-our-xg-models/
Gaelic Football Expected Points (ExpP).
While soccer is low scoring, with relatively few shots, Gaelic Football is not. Therefore what the sport lacks in # of games it ‘sort of’ makes up for in the number of shots and scores per game. James over on the blog dontfoul gives a very good account of his model here and it’s well worth reading. Our models are not identical but the fundamentals are the same and from some of the results I’ve seen the outcome is very very similar.
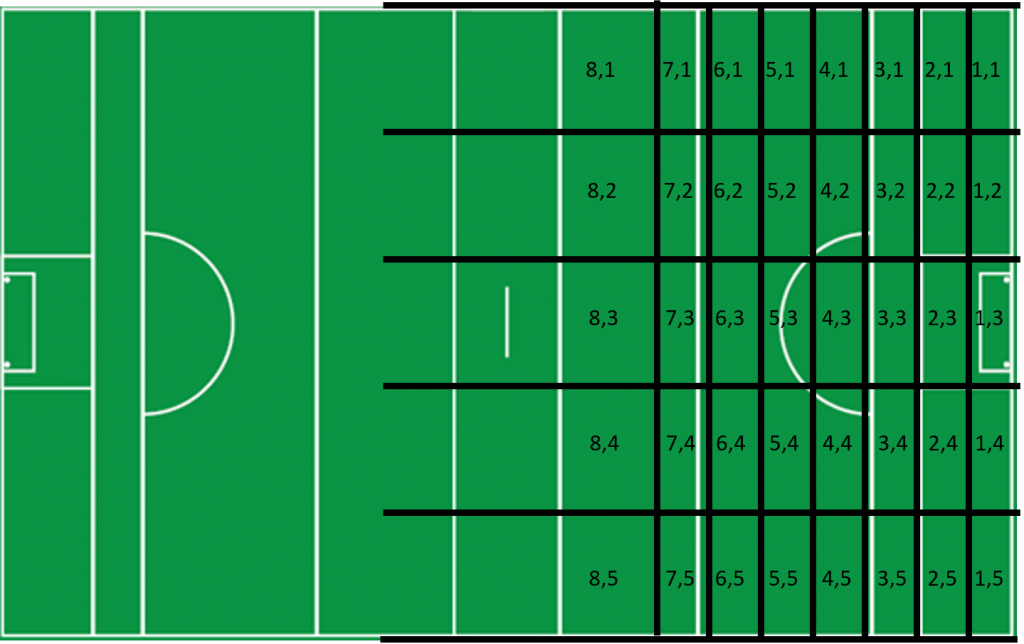
ExpP is a pretty simple concept. You effectively break the pitch into scoring zones. In my case I use 40 zones. 5 from touchline-to-touchline and 8 zones progressing approximately every 7 meters.
So you take all the shots from a given location (let’s say there are 100 from a certain location and 50 of them have been converted for points). The ExpP for that zone is .5 (50/100). In my model I have over 14,000 shots across all the zones.
If a player takes 8 shots from that location in a game we would expect him (based on the average) to score 4 points. If he scores 6 he is +2 points better than the average footballer.
The models can get much more complex than this and you can build in factors such as opposition strength, # of defenders between shooter and the goal, pressure on the kicker, game state, ground (think Hill 16) and so on. For now I’m going to run with the simple version above.
So we take out 14,000 shots. Divide them up into the 40 zones, break them down if they were from play, from placed ball or from a penalty. For each zone and shot type we get an ExpP number. Every time someone takes a shot from that location we can compare him or his team to what we would expect.
In Action
Spurred on by Richard Whitall doing something similar for soccer on his new site frontoffice.report here is what the Expected Goals looks like against the actual chances and in it I hope to highlight while ExpP is a great way to look at players over the long run, it does have weaknesses if we just look at chance x chance or even game x game.
I’ll use the League final and just a few examples to show how this works.
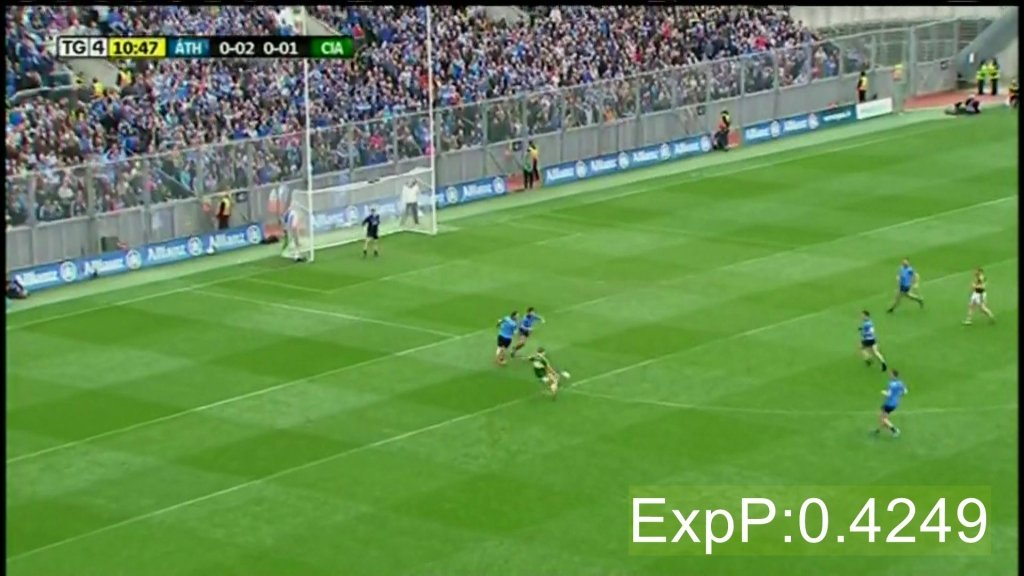
Stephen O’Brien Point
You can see here that O’Brien slots what seems like an easy chance over. However we would only expect inter-county players to score this 42% of the time. So while it looks easy a score here is not a gimme.
Cormac Costello Point
Cormac Costello slots over a point from distance in the 2nd half. It’s the other side of the pitch than the example above but a very similar expected return.
Paul Flynn Goal
Paul Flynn’s goal happens in zone 2;3. I’ve recorded 596 shots from play from that zone. 152 goals have been scored and 167 points. This means that from this location (ignoring all other factors) we would expect a team to score just over 1 point (1.045 to be exact)* for every attempt.
I think we can all agree that the ExpP model is underestimating how good a chance this is. Despite my belief that ExpP is a great way to look at players and teams it is not without its flaws. While we wouldn’t expect Flynn to score 100% of the time, expecting him to score a goal just 33% of the time from here is underestimating him. And the following 2 images show why that is.
The model treats these 3 shots in exactly the same way i.e. they happened in the same location. Although we can see from the screen grabs that the attacker is facing very different situations in each case. In the long run Paul Flynn will attempt many shots from the location he scored the goal from on Sunday so 1.005 is accurate over his career, just not in this individual case.
ExpP is really useful when looking over the long run, a much better indicator of a players true ability, rather than just looking at Shot % or Total Scores. But this is the health warning. Looking at 1 shot or even a full game a model is going to be flawed. Teams can have an eye on the long run but ultimately deal in the here and now. That’s why video analysis is so important for them.
I’ll publish more about this during the summer and I will start to build in some other factors rather than just location but for now consider this the introduction.


