Yesterday I wrote an article about an expected points (ExpP) model I had created for football. This is not a new concept. Dontfoul has a weighting model, there are numerous examples for most field sports and Golf has a strokes gained metric. They all work off the same basic principle. How much better is player X than the average player. Granted this comes with a lot of question’s about who this imaginary average player is, but the results of these models can be fascinating.
As the All Stars list has been announced and the team will be selected along with player of the year there is at lest 3 positions where we don’t have to rely solely on opinion. The forwards. Sure we can turn to the Top scorer chart, but what does that really tell us? The structure of the championship means it is virtually impossible for anybody but a small group of players to win this. Some teams play 7 games while 16 teams will only feature twice.
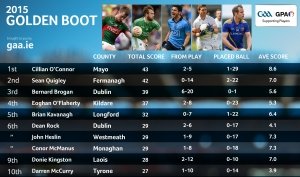
Here it is anyway. The Top Scoring Chart for 2015
What is interesting is that we can now compare these players to what the average inter-county player would have scored given the same opportunities. So did Bernard Brogan score 39 points this year because he plays he get’s easy chances, because he is supremely good or a bit of both? Likewise for Cillian O’Connor, his his score total dominated by handy frees?
Below is the top 20 players based on Points above Expected (Shots gained if you are a golf fan).
Bernard Brogan, not only scored 39 points and won an All Ireland title, but compared to every other player he added 8 points more than the average footballer. To contrast this with his season in 2014 shows the value of these metrics. In 2014 he scored 24 points, not a bad return, and one that puts him in the top 10 scorers for that year. However an average footballer would have scored 27 points given the same opportunities. So in fact that’s a -3 point in 2014.
Same player, in 2 consecutive seasons being in the Top 10 scorers but the numbers telling a very different story.
For reference here is the Top 10 in 2014.
*Note the ExpP model is based on games I have analysed. In all cases for comparisons between ExpP and Actual Points I have used the actual points scored in games analysed rather than their season total across all games.


